Graduate Outcomes
Physician Assistant National Certifying Examination (NCCPA) Performance Summary Report
National pass rates available here
For more information on NCCPA and certification standards visit https://www.nccpa.net/.
Student Attrition, Graduation Rates, PANCE Outcomes, Employment Data
Our most current information is provided below:
The program has an attrition rate of 2% (2 out of 96) over the last 3 class year cohorts. This is well below the national average of 6.8% (PAEA 35th Program Report published in 2020).
| Class of 2020 | Class of 2021 | Class of 2022 | Class of 2023 | Class of 2024 | |
|---|---|---|---|---|---|
| Maximum entering class size (as approved by ARC-PA) | 28 | 32 | 36 | 36 | 36 |
| Entering class size | 28 | 32 | 36 | 36 | 36 |
| Graduates | 27 | 31 | 36 | # | # |
| * Attrition rate | 4% | 3% | 0% | # | # |
| **Graduation rate | 96% | 97% | 100% | # | # |
*Attrition rate calculation: Number of students who attrited from cohort divided by the entering class size.
**Graduation rate: Number of cohort graduates divided by the entering class size.
| PANCE Certification Data | Class 2020 | Class 2021 | Class 2022 | Class of 2023 | Class of 2024 |
|---|---|---|---|---|---|
| Program: PANCE first pass rate *** | 96% | 100% | 92% | # | # |
| National Average: PANCE first pass rate *** | 95% | 93% | 92% | # | # |
| Program PANCE performance all exams taken | 100% | 100% | 100% **** | # | # |
*** PANCE rate: Program first pass rate is the rate for all students on their first attempt at taking the PANCE exam
**** PANCE rate: after all exam attempts complete. Current to date 05/30/2023
Graduation Employment
| Cohort | Graduated | Reported | % Employed as PA-C (reported) | Unreported | Pending Certification |
|---|---|---|---|---|---|
| 2020 | 27 | 26 | 100% | 1 | 0 |
| 2021 | 30 | 30 | 100% | 0 | 0 |
| 2022 | 34 | 18 | 100% | 13 | 2 |
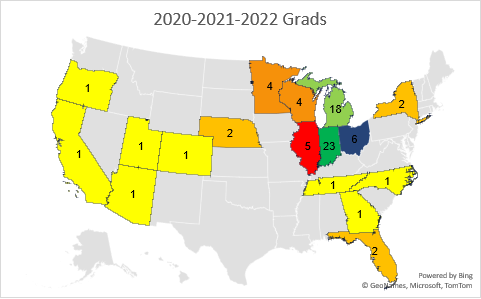
Graduation Employment By State